
At the Skills Builder Partnership, we’ve always believed that essential skills are the key to unlocking potential. But to unlock that potential, we need to understand where we are starting from. Measurement is only the beginning: the real value of data is found in the introspection, conversations, and actions it sparks to drive meaningful progress.
Today, Skills Builder Benchmark is evolving. We have redesigned how Benchmark presents your information, moving from static data displays to a dynamic tool supported by intuitive visuals. Our goal is simple: to bridge the gap between assessment and action. We want to help everyone, from students to senior managers, understand their current skill profile, record meaningful self-reflections, and see exactly how they are building their essential skills over time.
You Said, We Did
We’ve listened closely to our global network of partners to ensure these updates support deeper development and self-awareness:
You said:
"I want to switch between my own skills and my learners’ data more easily."
We did:
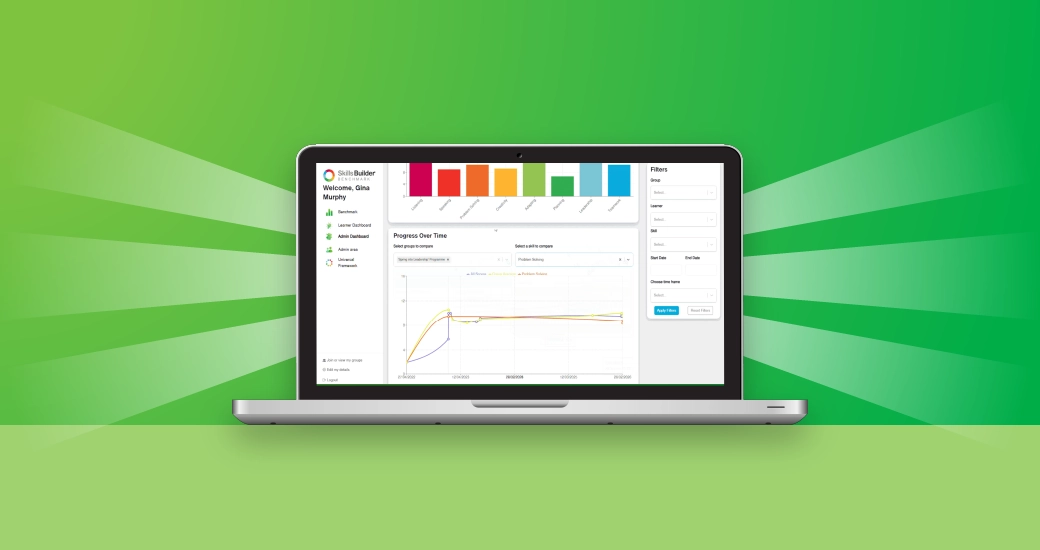
We’ve introduced a streamlined sidebar. Whether you are an Admin or Learner, everything you need is now in one persistent menu on the left, making it easier to manage both your own development and your Learners’ data.
You said:
"I need to see my current standing and my growth at a glance."
We did:
We’ve launched visual dashboards. You can now see your current skills profile and track your progress through a range of new charts. This visual clarity is designed to encourage regular self-reflection, helping you identify exactly where you are and what to work on next.
You said:
"I need to slice the data to find specific insights for my learners."
We did:
Our new filtering tool allows you to slice and dice data any way you like. Filter by group, date, or specific skill to see exactly where progress is being made and to identify priority areas for future development.
Practical Info & FAQs
Where can I find the 'My Learners' tab?
The functionality previously found in 'My Learners' has moved to the Admin Dashboard. In the left panel, click Admin Dashboard and select the Reports tab at the top to access detailed data tables, including new high-demand views like Current Scores and Overall Progress.
How do I export my data?
Head to the Reports tab in your Admin Dashboard, use the filters to narrow down your view, and click the ‘Download Report’ button for a custom CSV file. The download will reflect any filters you have applied.
Is my old data safe?
Absolutely. No data has been deleted. Every historical self-assessment has been safely migrated and will automatically appear in your new visual charts and reports.
What if I can't see the new layout?
If things look unusual, simply refresh your browser or log out and back in again. Our support team is on hand if you need any extra help.
Looking Ahead
This launch is just the start of an exciting new chapter for Benchmark. We have more features shipping in the coming months as we continue to listen to your feedback. This helps us shape a tool that provides the deep data visibility and insights you need to measure impact, while actively prompting the self-reflection that drives meaningful, long-term development.
Curious to see it in action?
Log in to your Benchmark account today to explore the new dashboard. And remember, Benchmark is always free for individual learners to assess and track their own essential skills.